Worker Visas and Green Cards: What are the Acceptance Rates in the US?

Borderless Counsel frequently assists clients with applications for permanent and temporary work visas in the United States. The brief report below aims to capture the recent rates of visa application approvals, and their distribution across continents and countries. We focus in particular on the worker visas most frequently sought after by our clients: the non-immigrant L1-A, L1-B and H-1B visas; and the immigrant/green card EB-1, EB-3, and EB-5 visas. All data was sourced from the U.S. Department of State’s Visa Statistics. In this post we will focus on the H-1 and L-1 Visa categories. In our upcoming post, we will outline visa statistics for the EB-1, EB-3 and EB-5 (green card/permanent residency) categories).
Temporary Worker Visas
Temporary Worker Visas allow applicants to remain in the United States for a fixed period of time attached to their employment arrangements.
L/Intracompany transferee visas
L-1A Visa: for intracompany transferees who work in managerial or executive position in a company that is located outside the US
L-1B Visa: for intracompany transferees who work in positions requiring specialized knowledge
L-1 Visa Approvals, Refusals, and Total Applications


Data by Country
The US Department of State does not provide statistics on the denial rates for L-1 visas for particular countries. However, it does provide the number of L-1 visas granted according to country/territory. Below are some salient numbers from the US Department of State statistics on specific visas for the last fiscal year of 2021.


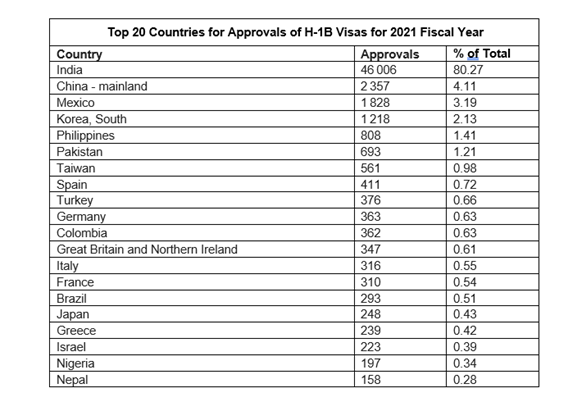
H-1B (Person in Specialty Occupation) Visa
For individuals who are working on their area of specialization in the US, including fashion models, inter-governmental collaborators on research and development projects, and members of collaboration organized by the Department of Defense.


The US Department of State does not provide statistics on the denial rates for H-1B visas for particular countries. However, it does provide the number of H-1B visas granted according to country/territory. Below are some salient numbers from the US Department of State statistics on specific visas for the last fiscal year of 2021:

Trends:
The data for both L1 visas and H-1B visas shows drastic decreases in the number of total applications from the year 2017 compared to 2021 (down by almost 70,000 and 150,000 respectively). The decrease coincides with the onset of the Covid-19 pandemic in early 2020.
In correlation with this drop in total applications, the rates of application approvals shot up to 94.2% in 2021 from 82.5% in 2017 for L-1 visas, and up to 92.9% in 2021 from 83.2% in 2017 for H-1B visas. Although these ranges reflect an overall striking change in the rate of approvals, data from the last three years also indicate an emerging divergence in the trends between the two visa types – the proportion of application approvals has increased since 2019 by about 4.2%, while the proportion of approvals for H-1B visas has declined since 2019 by about 5%.
The U.S. Department of State issued the majority of L1 visas and H-1B visas in the last fiscal year to applicants from Asia. Indian temporary workers constituted the largest group of applicants from any country for both visa types, while China ranked eighth for L1 visas and second for H-1B visas. Mexico and South Korea were also amongst the top five countries issued the most L1 and H-1B visas.
In this post, we focused on non-immigrant visa categories. In our next post, we will talk about the statistics for permanent resident/green card visa categories for workers in the United States. Stay tuned!
If you have any further questions regarding these statistics or assistance with applying for temporary or permanent work visas, contact Borderless Counsel today!